Process Scheduler
The CPU can execute only a limited number of tasks at any moment. Hundreds or even thousands of processes and threads may be ready to run. The scheduler is how Linux chooses among them.
Start with what the scheduler actually decides ↓
The Process Scheduler is one of the most important parts of Linux
The Process Scheduler is one of the most important parts of the Linux kernel because the CPU can execute only a limited number of tasks at any moment. On a system, however, hundreds or even thousands of processes and threads may be ready to run. The scheduler decides which task gets CPU time, on which CPU core, and for how long. Its goal is to keep the system responsive, share CPU time fairly, and make good use of all available cores.
A simple way to visualize it is:
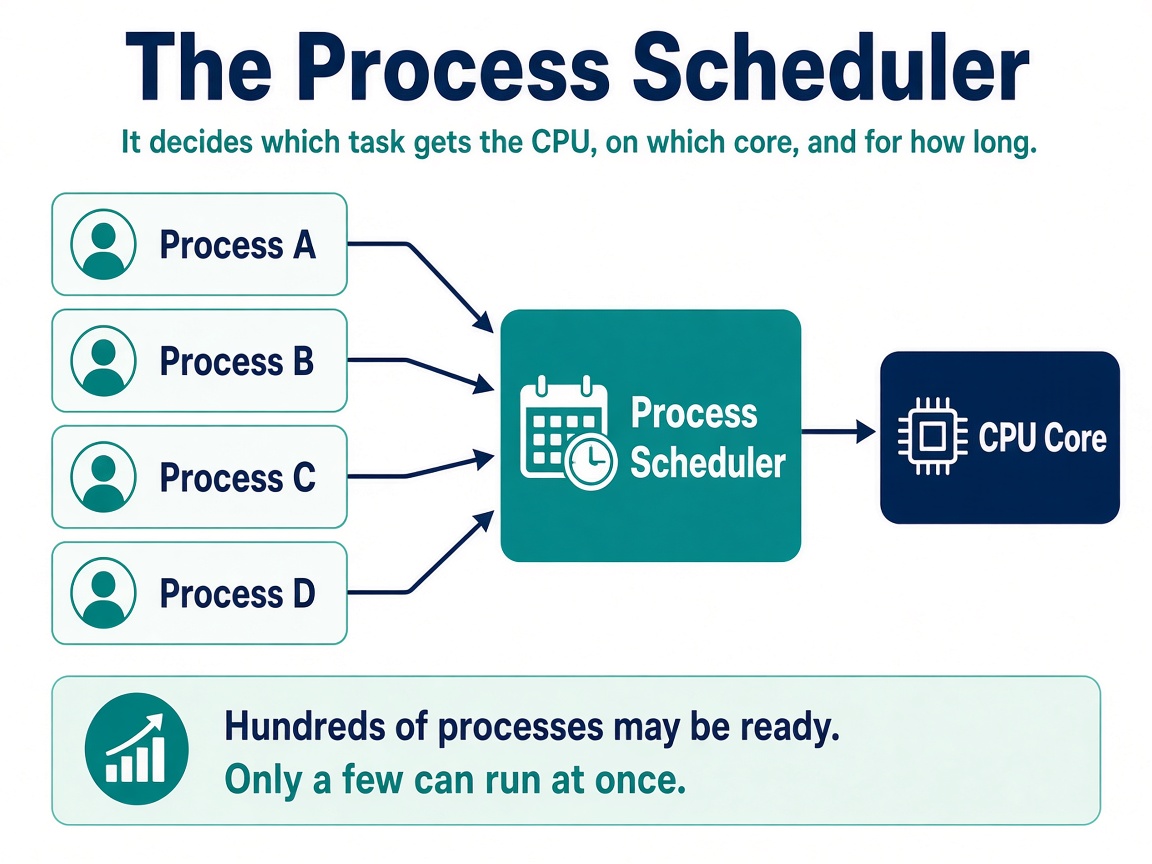
If several processes are ready at the same time, the scheduler chooses one of them to run. After that process has used some CPU time, becomes blocked, or is preempted, the scheduler may select another process. The switch from one running task to another is called a context switch.
For example:
The scheduler also works closely with process states. A process may be:
For example, suppose a process is waiting for data from disk or the network. There is no point in keeping it on the CPU while it waits, so the kernel can put it to sleep and allow another runnable process to use the CPU.
On a multi-core system, the scheduler also decides which core should execute a task:
It may also move tasks between cores to keep the workload balanced. This is known as load balancing.
The Linux process scheduler decides which process or thread gets the CPU, when it gets the CPU, and for how long.
Now that you understand the basic role of the Process Scheduler, the next step is to understand what exactly the scheduler is scheduling and how we can observe it on a Linux system.
Before going further, we need to understand two words
A process is basically a running program.
For example:
python app.pycreates a Python process.
A process can contain one or more threads. Threads are smaller units of execution inside that process.
On a multi-core system, different threads can potentially run on different CPU cores:
Linux scheduling is actually performed at the task/thread level, which is why multithreaded applications can make use of multiple CPU cores.
A process is not always running
One of the most important things to understand is that a process does not spend its entire lifetime executing on the CPU.
Sometimes it is running. Sometimes it is ready to run but waiting for CPU time. Sometimes it is waiting for disk or network activity. Sometimes it has already finished.
Linux represents these situations using process states. The most important ones are:
- R = Running / Runnable
- S = Sleeping
- D = Uninterruptible Sleep
- T = Stopped
- Z = Zombie
These states are extremely important during Linux troubleshooting and interviews.
Running or Runnable
R means the process is either currently using a CPU or is ready to use one.
Imagine four processes but only one available CPU:
Waiting for CPU
Processes B, C, and D are ready to run. The scheduler decides when each of them gets CPU time.
So R does not always mean “this process is currently executing.”
It can also mean “this process is ready and waiting for CPU.”
Sleeping
Most processes on a normal Linux server spend a lot of time sleeping.
Sleeping simply means: the process has nothing useful to do until something happens.
For example, Nginx may be waiting for a new request.
Once a request arrives:
So seeing many processes in S state is completely normal.
Uninterruptible Sleep
D state is much more interesting.
A process usually enters D state when it is waiting inside the kernel for something such as:
NOTE: “Waiting inside the kernel” means the process made a request to the kernel and is blocked until that kernel operation, usually I/O, finishes.
- Disk I/O
- NFS
- Storage
- Filesystem
- Device
- Driver
For example:
The process is alive, but it cannot continue until that kernel operation finishes.
This leads to one of the most famous Linux interview questions:
Why doesn't kill -9 kill a process stuck in D state?
Because the process is currently waiting inside the kernel.
Even if we send:
kill -9 1234Linux may not terminate it immediately. The process first needs to return from that uninterruptible kernel operation.
That means if a process remains in D state for a long time, the real question is not “How do I kill this process?”
The better question is: What is this process waiting for?
It could be a slow disk, broken NFS mount, storage problem, driver issue, or another I/O problem.
To check processes currently in D state (uninterruptible sleep) on Linux, use:
ps -eo pid,ppid,state,comm,wchan:32 | awk '$3 == "D"'You can also quickly check with:
ps aux | awk '$8 ~ /^D/'Zombie Process
A zombie is completely different from a process in D state.
A zombie process has already finished running.
Suppose a parent creates a child process:
The child finishes:
When the child exits, Linux keeps a very small amount of information about it so that the parent can check how it finished. The parent normally collects this information using something like:
wait()After that, Linux completely removes the child.
But what happens if the parent does not collect the result?
That process appears as Z, or sometimes <defunct>, in commands such as ps.
Can we kill a zombie?
Another classic interview question:
Can we kill a zombie process using kill -9?
No. Why? Because the zombie is already dead. There is nothing left to kill.
The problem is actually with its parent process, which has not collected the child's exit information.
That gives us a very easy way to remember the difference:
D state
Z state
To check for zombie processes on Linux, look for process state Z.
ps -eo pid,ppid,state,stat,comm | awk '$3 == "Z"'A simpler command is:
ps aux | awk '$8 ~ /^Z/'You can also use:
ps -el | grep ' Z 'Linux needs a bookmark when it changes books
Now suppose we have one CPU and three runnable processes: Process A, Process B, and Process C.
The scheduler may run them like this:
Time ─────────────────────────────→
When Linux stops running Process A and starts running Process B, that is called a context switch.
Linux needs to remember where Process A stopped so that it can continue later.
Think of reading two books. You are reading Book A. Someone asks you to read Book B. You put a bookmark in Book A, switch to Book B, and later return to exactly where you stopped.
Linux does something conceptually similar.
Context switching is necessary, but it also has a cost. If the system switches between tasks excessively, CPU time is being spent switching instead of doing useful work.
Does a process in D state or Zombie state increase the load average?
Yes, but in very different ways.
A process in D state can increase the Linux load average, even though it may be using little or no CPU. Linux load average includes tasks that are either runnable (R) or stuck in uninterruptible sleep (D). So if many processes are waiting on disk, NFS, storage, or another kernel I/O operation, you can see a high load average while CPU utilization stays relatively low.
For example:
CPU usage:     20%
Load average:  15.0
That can happen when many processes are in D state waiting for I/O.
A zombie (Z) process, on the other hand, does not consume CPU and does not normally contribute to load average. It has already finished executing. It remains only as a small process-table entry because its parent has not yet collected its exit status.
A useful way to remember it:
| State | CPU usage | Contributes to load average? |
|---|---|---|
| R Running / Runnable | Yes / potentially | Yes |
| D Uninterruptible sleep | Usually no | Yes |
| S Sleeping | No | No |
| Z Zombie | No | No |
This is why high load average does not always mean high CPU usage. A server with many D-state processes can have a very high load while the CPUs are mostly idle.
CPU utilization and load average are not the same thing.
Think of it this way:
CPU usage
Load average
So you can absolutely have:
CPU Usage:     15%
Load Average:  20
and that is not contradictory.
For example, imagine 20 processes are stuck waiting for slow storage:
State = D. The CPU might be mostly idle, but Linux still counts those tasks toward load average.
A very useful mental model is:
CPU utilization = how busy the CPUs are.
Load average = how much work is competing for CPU or stuck waiting on uninterruptible I/O.
And this leads to a great troubleshooting lesson:
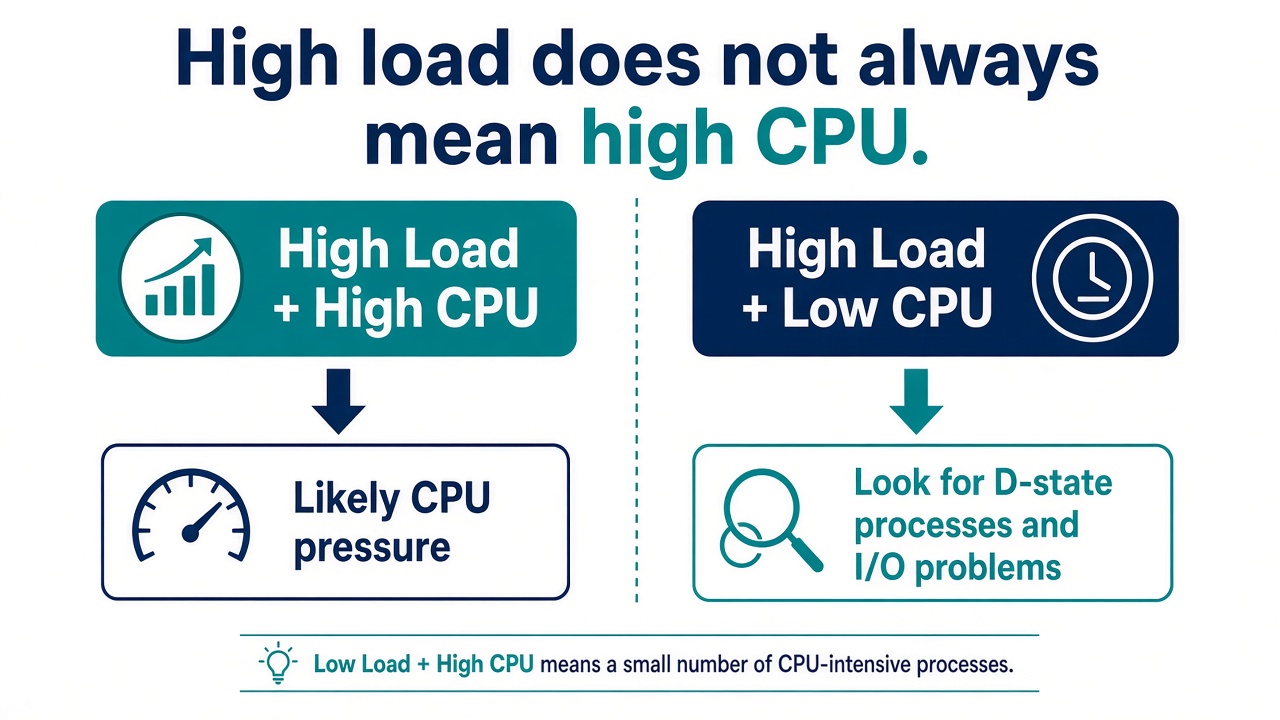
This distinction is actually one of the most important things to understand when troubleshooting Linux performance.
Voluntary and involuntary context switches
There are two useful types.
A voluntary context switch happens when a process cannot continue and gives up the CPU.
An involuntary context switch happens when the process could continue running, but Linux decides another task should get CPU time.
In simple terms:
Voluntary
“I cannot continue right now.”
Involuntary
“You have had enough CPU for now.”
What happens with more than one CPU?
Most modern machines have several CPU cores. Suppose we have four cores:
Linux tries to distribute work across those CPUs. If this happens:
CPU 0 = 100%
CPU 1 = 100%
CPU 2 = 5%
CPU 3 = 3%
the scheduler may move runnable tasks so that the workload is distributed more efficiently. This is known as load balancing.
Sometimes we restrict which CPU a task may use
Normally Linux is free to move a task between CPU cores.
But sometimes we want a process to run only on certain CPUs. This is called CPU affinity.
For example:
taskset -c 2 ./my_applicationmeans: run this application on CPU 2.
CPU affinity is useful in areas such as performance testing, databases, low-latency applications, NUMA systems, and some high-performance or GPU workloads.
For a beginner, however, the most important idea is simply:
Normally the scheduler chooses the CPU. CPU affinity lets us restrict that choice.
How do we see process states?
One of the easiest commands is:
ps -eo pid,ppid,stat,commYou may see:
PID    PPID   STAT   COMMAND
1200     1      S    nginx
1400     1      R    python
1600     1      D    backup
1800  1500      Z    worker
Now the letters actually mean something:
- R → Ready / running on CPU
- S → Waiting normally
- D → Waiting inside kernel, often for I/O
- Z → Already finished, waiting for parent cleanup
That is much more useful than simply memorizing the letters.
top
The next command is:
topIt gives us a live view of processes and CPU usage. Some useful CPU values are:
- us = CPU time running user applications
- sy = CPU time running kernel code
- id = CPU idle time
- wa = CPU time associated with I/O wait
vmstat
Another very useful command is:
vmstat 1Two scheduler-related fields worth watching are r and cs. r represents runnable tasks, while cs represents context switches.
If a machine has 4 CPUs but consistently has a large runnable queue, such as:
CPUs = 4
Runnable tasks = 25
many tasks are competing for CPU time. That can be an indication of CPU contention.
pidstat
To look at individual processes:
pidstat 1And to examine context switches:
pidstat -w 1This can show voluntary and involuntary context switches for each process.
mpstat
To look at individual CPU cores:
mpstat -P ALL 1This helps answer questions like: is the whole machine busy, or is only one CPU core overloaded? That distinction can be very useful during troubleshooting.
Suppose someone tells us: “The server is slow.”
Instead of immediately restarting something, we can start building a picture:
Now the scheduler is no longer just theory. It becomes part of our troubleshooting process.
And this still matters for GenAI
Even if an application is using GPUs, there is still significant CPU-side activity.
For example:
So the key idea to remember is:
The Linux scheduler decides which task gets CPU time, where it runs, and when another task should take its place. Process states such as R, S, D, and Z help us understand what each process is doing—or waiting for—at any given moment.
Once you move beyond ps and top
Linux gives you several much more powerful commands for understanding what a process is doing, what it is waiting for, which threads it has, which files it opened, how much memory it uses, and where CPU time is going.
A good advanced toolkit is:
| What you want to inspect | Command |
|---|---|
| Detailed process information | ps |
| Parent/child relationship | pstree |
| Per-process CPU usage | pidstat |
| Threads inside a process | ps -L, top -H |
| Open files / sockets | lsof |
| Process memory map | pmap |
| Kernel / process details | /proc/<PID>/ |
| System calls | strace |
| CPU performance | perf |
| CPU affinity | taskset |
| Scheduling policy / priority | chrt |
| What a blocked process is waiting on | wchan, /proc/<PID>/stack |
If you remember only four things
1. The scheduler chooses who runs. It decides which process or thread gets the CPU, on which core, and for how long.
2. R, S, D, and Z are not trivia. They tell you whether a process is competing for CPU, waiting normally, stuck inside the kernel, or already finished.
3. Load average is not CPU usage. D-state tasks can raise load while the CPUs sit idle. Zombies do not.
4. GenAI still has a CPU side. Tokenization, networking, request handling, and GPU submission are still scheduled by Linux.