Build an Apache Log Analyzer Using LangChain and OpenAI
In the previous lessons, we saw how Large Language Models can help DevOps engineers investigate real infrastructure problems. Today, we are going to apply the same idea to something every DevOps, SRE, or system administrator works with: logs.
Start with why logs are hard to read by hand ↓
Prefer watching the complete implementation?
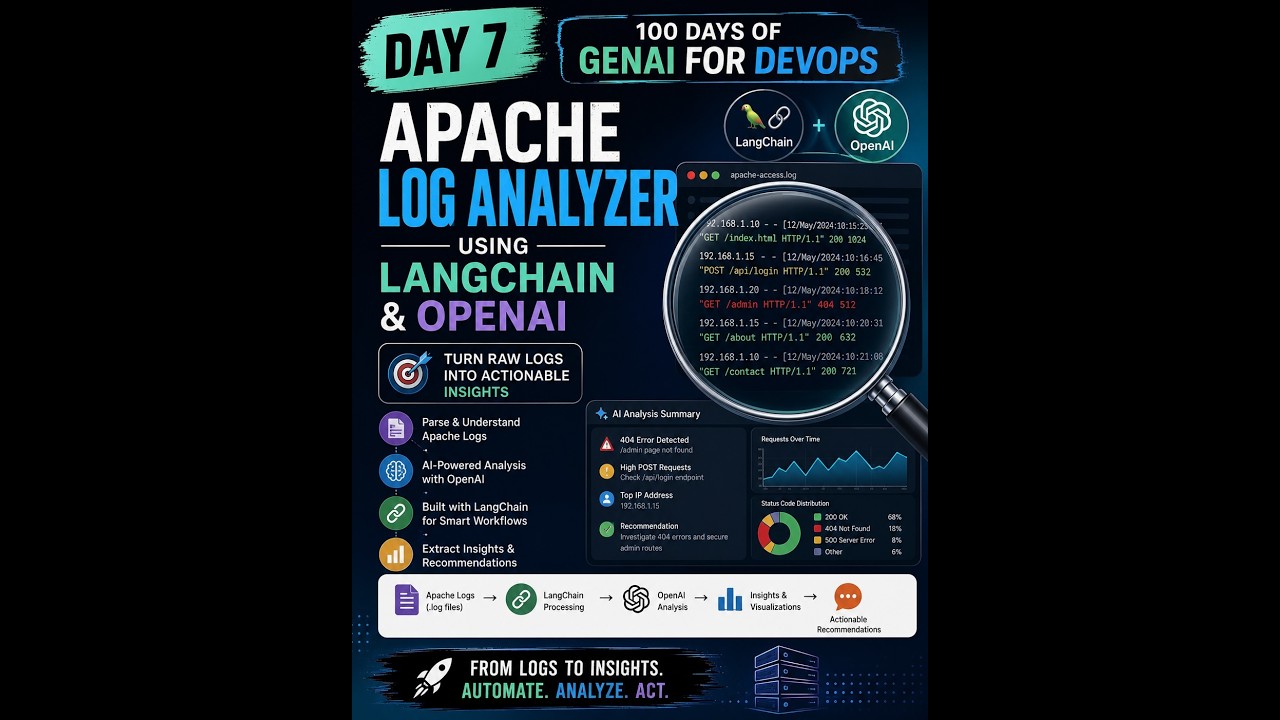
We are going to build an Apache Log Analyzer using LangChain and OpenAI.
The basic idea is very simple:
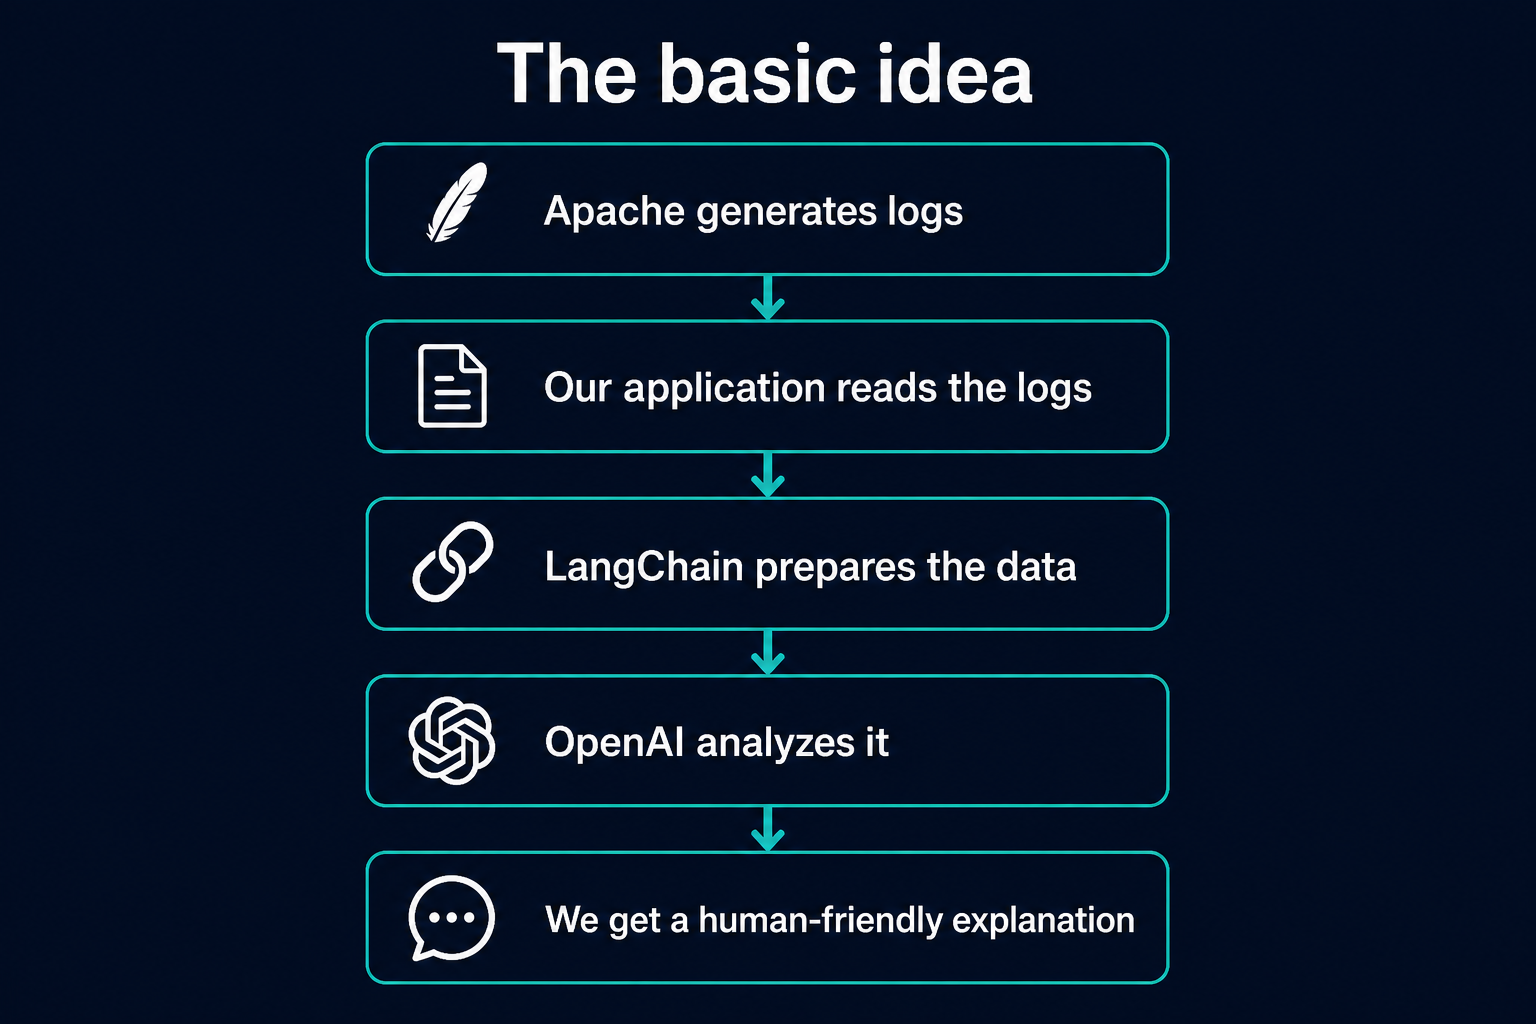
Instead of manually reading hundreds or thousands of log lines, we will use an LLM to help us answer questions such as:
What errors are happening?

Which URLs are failing?

Are we seeing many 404 errors?

Are there server-side 500 errors?

Which IP addresses are making unusual requests?

Is there anything suspicious in these logs?
By the end of this lesson, you should understand not only how to build the analyzer, but also why LLMs can be useful for log analysis.
The code for this lesson is in this GitHub repo: llm_log_analysis.
Let's start with the problem
Imagine you are responsible for an Apache web server.
Everything seems fine, and then someone reports:
The website is throwing errors.
As a DevOps engineer, one of the first things you will probably check is the logs.
Apache commonly records information about incoming requests and errors.
You may start looking at files such as:
/var/log/apache2/access.log
and:
/var/log/apache2/error.log
Depending on the Linux distribution, the exact path may be different.
The important point is that Apache keeps a record of what is happening.
What does an Apache access log look like?
A log line might look something like this:
192.168.1.10 - - [18/Aug/2026:10:15:32] "GET /index.html HTTP/1.1" 200 1024
At first, this may look confusing.
But it contains useful information.
We can simplify it:
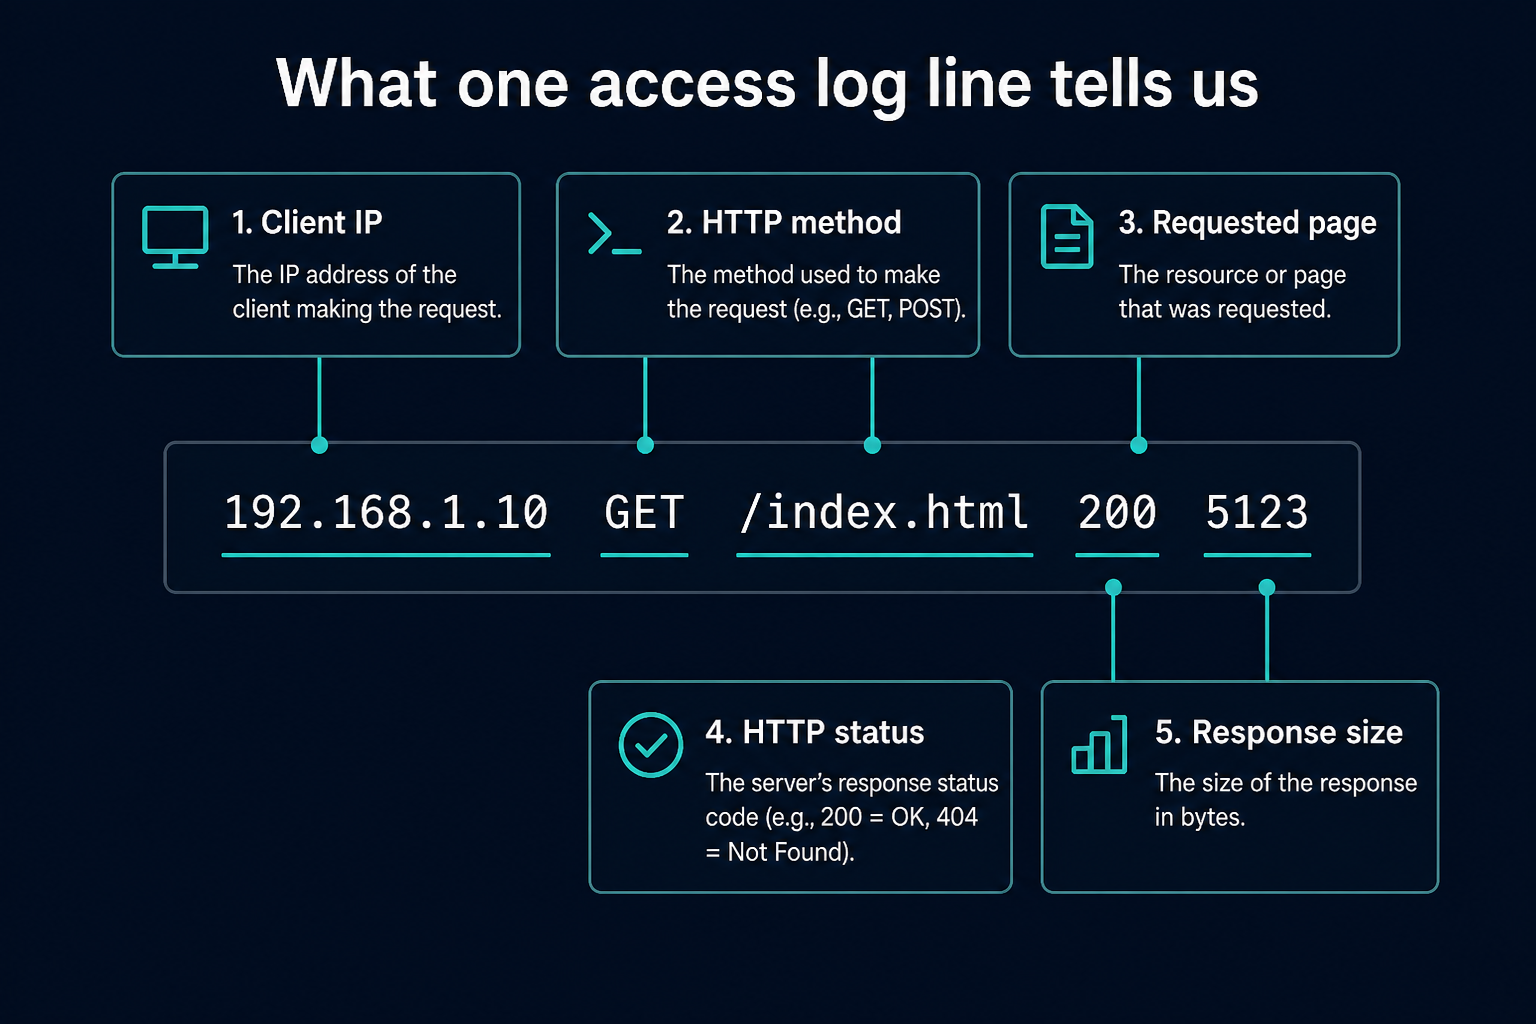
So one log line tells us:
A client with IP192.168.1.10requested/index.html, and Apache successfully returned the page.
The important value here is:
200
which means the request was successful.
What happens when something goes wrong?
Now imagine we see:
192.168.1.15 - - [18/Aug/2026:10:16:02] "GET /admin HTTP/1.1" 404 512
The response code is:
404
which generally means:
The requested resource could not be found.
Or perhaps we see:
192.168.1.20 - - [18/Aug/2026:10:17:41] "GET /api/users HTTP/1.1" 500 120
Now we have:
500
which generally indicates a server-side error.
Already, the logs are starting to tell us a story.
Why are logs difficult to analyze?
Looking at five log lines is easy.
Looking at:
10 lines
is easy.
Looking at:
100 lines
is manageable.
But production systems may generate:
Thousands
Millions
or even billions
of log events over time.
Now imagine someone gives you a log file like this:
200
200
200
404
200
200
500
200
403
404
500
200
200
...
and asks:
What happened?
Finding useful information manually becomes difficult.
You might need to use commands such as:
grep
awk
sed
sort
uniq
tail
or dedicated observability platforms.
Those tools are still extremely useful.
But LLMs can add another layer:
They can help explain what the logs mean in normal human language.
Traditional log analysis
Suppose we want to find all 500 responses.
We could use:
grep " 500 " access.log
Maybe we want to count them:
grep " 500 " access.log | wc -l
This works very well.
But now imagine someone asks:
Look at these logs and explain the main problems with this web server.
That requires more reasoning.
You might have to determine:
Which errors occur most often?

Which endpoints are affected?

Are failures coming from one IP?

Did the problem happen during a particular period?

Is there a suspicious request pattern?

What should we investigate next?
This is where an LLM becomes interesting.
What are we going to build?
Our application will roughly follow this flow:
Apache Log File
       ↓
Python Application
       ↓
Read the log
       ↓
Prepare the log data
       ↓
LangChain
       ↓
OpenAI
       ↓
Analyze the logs
       ↓
Human-readable response
For example, instead of manually searching the log, we might eventually ask:
What are the main errors in this log?
And receive something like:
The logs show three main problems:

1. Multiple 404 responses for /admin.
2. Several 500 responses from /api/users.
3. One IP address is making a large number of repeated requests.

The 500 responses should be investigated first because they
indicate a server-side application problem.
This is much easier for a human to understand.
But first — what is LangChain?
Before writing the application, let's understand what LangChain is doing.
Suppose you want to send something to an LLM.
At the simplest level:
Python
   ↓
OpenAI API
   ↓
LLM
   ↓
Response
You can absolutely call an LLM directly.
But as applications become more complex, you may need to manage things such as:
Prompts
Documents
Context
Models
Output processing
Retrieval
Tools
Agents
LangChain provides building blocks that help connect these pieces together.
For a beginner, I like to think of LangChain as:
A framework that helps us connect our application data with an LLM.
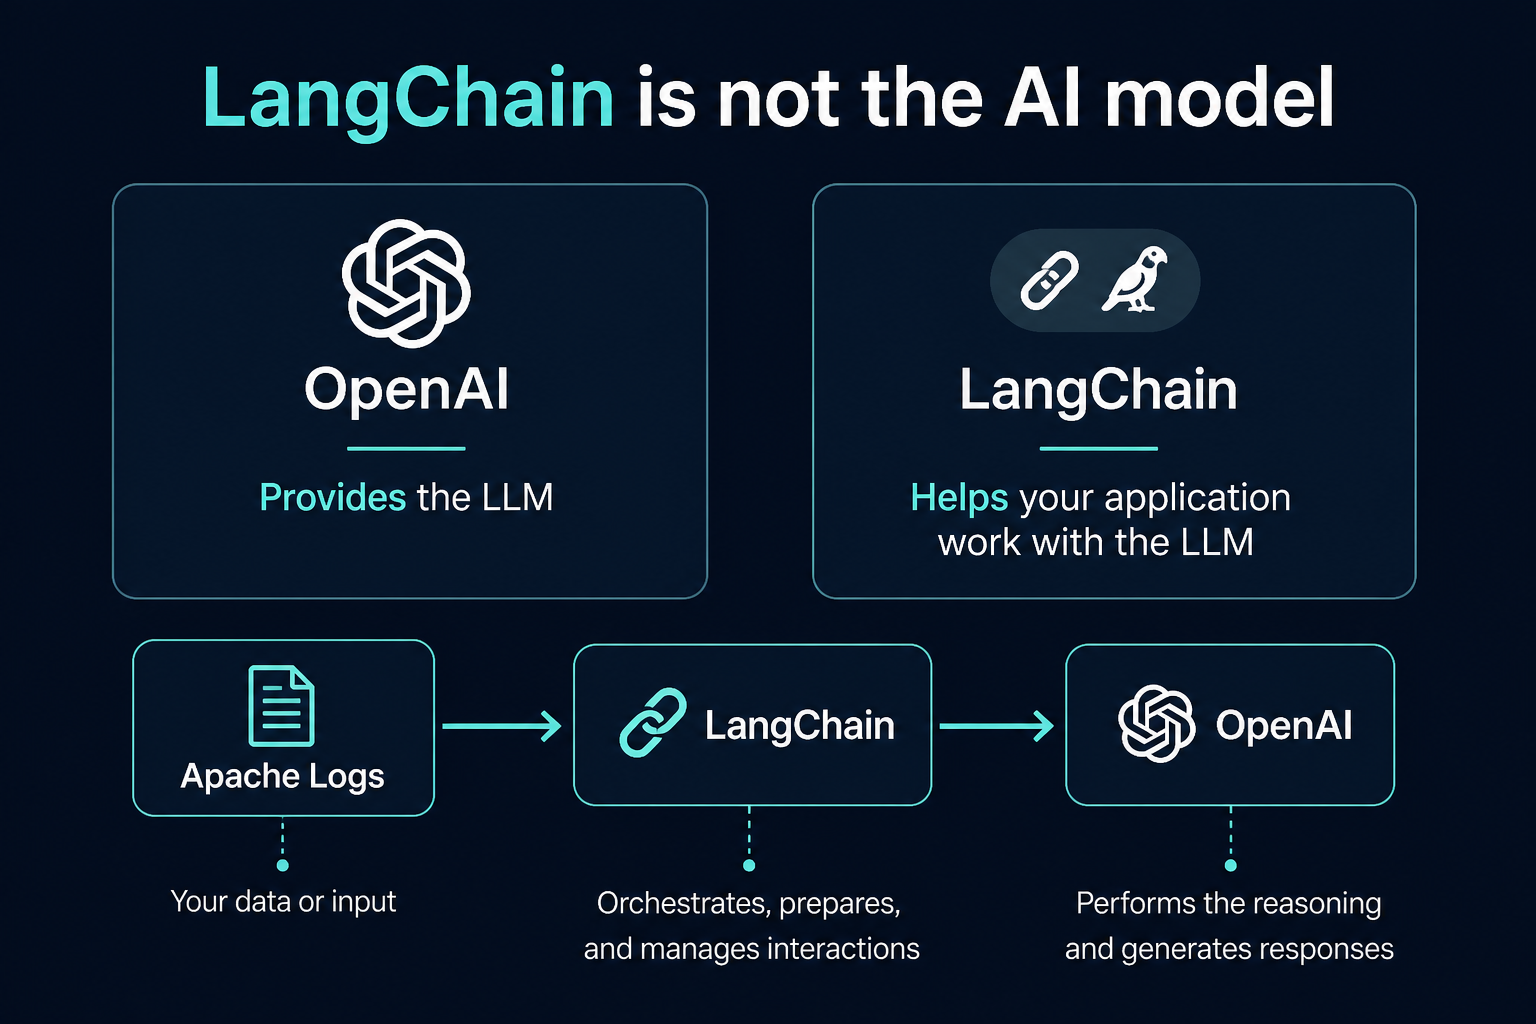
LangChain is not the AI model
Without LangChain:
Your Python Code
       ↓
Build API request yourself
       ↓
Send prompt
       ↓
OpenAI
       ↓
Handle response
With LangChain:
Your Python Code
       ↓
LangChain components
       ↓
Prompt + Data
       ↓
OpenAI
       ↓
Response
LangChain does not replace the LLM.
OpenAI is still providing the model.
LangChain helps us organize the application around it.
That distinction is important.
Beginners sometimes confuse these two.
Think about it this way:
What information do we want from the logs?
Before sending anything to an LLM, we should decide what we actually want it to analyze.
For a web server, we might care about:
HTTP status codes
Failed requests
Requested URLs
Client IP addresses
Repeated requests
Error patterns
Suspicious activity
Possible causes
Recommended troubleshooting steps
For example, consider these log lines:
10.0.0.5 "GET /index.html" 200

10.0.0.8 "GET /admin" 404

10.0.0.9 "GET /api/users" 500

10.0.0.9 "GET /api/users" 500

10.0.0.9 "GET /api/users" 500
A human can quickly notice:
/api/users
is failing repeatedly.
We want the model to notice the same pattern.
The prompt matters
We should not simply send the logs and say:
Analyze this.
That instruction is very broad.
Instead, we can provide more context.
For example:
You are a senior DevOps engineer.

Analyze the following Apache access logs.

Identify:

1. HTTP errors.
2. Repeated failed requests.
3. Suspicious IP addresses.
4. URLs generating errors.
5. Possible causes.
6. Recommended troubleshooting steps.

Explain your findings in beginner-friendly language.

Logs:

...
Now the model understands what kind of analysis we expect.
This is called prompt engineering.
Why give the model a role?
Notice the first line:
You are a senior DevOps engineer.
We are telling the model what perspective to use.
Without this context, the model may simply summarize the text.
With a more specific role and instructions, we are saying:
Don't just read these logs. Analyze them as someone troubleshooting infrastructure.
That can help make the response more relevant to our use case.
Reading the Apache log
Our Python application first needs to read the log file.
Conceptually:
Python
   ↓
Open access.log
   ↓
Read log lines
   ↓
Store content
Now we have the raw logs inside our application.
For a small demo file, we can work with the content directly.
But there is an important production consideration.
Can we send an entire production log to an LLM?
Usually, this is not a good idea.
Imagine your log file contains:
5 MB
100 MB
2 GB
50 GB
We cannot simply send unlimited text to an LLM.
Models have limits on how much information they can process in one request.
It would also become expensive and slow.
Instead, real systems commonly use techniques such as:
Filtering
Chunking
Summarization
Retrieval
Pre-processing
For our learning example, however, keeping the log file small helps us understand the basic workflow.
What is chunking?
Suppose our log file contains:
10,000 log lines
Instead of trying to process everything as one giant block, we can divide it into smaller pieces.
For example:
Logs

Lines 1-500
    ↓
Chunk 1

Lines 501-1000
    ↓
Chunk 2

Lines 1001-1500
    ↓
Chunk 3
This process is called chunking.
The idea is simple:
Break a large document into smaller pieces that are easier to process.
This concept will appear again later when you learn about RAG and document-based LLM applications.
Sending the logs to the LLM
Once we have prepared our data and prompt, we can send them to OpenAI through LangChain.
Conceptually:
Instructions
     +
Apache Logs
     ↓
Prompt
     ↓
LangChain
     ↓
OpenAI
     ↓
Analysis
For example:
Apache Logs:

10.0.0.1 GET / 200

10.0.0.2 GET /login 200

10.0.0.3 GET /admin 404

10.0.0.3 GET /admin 404

10.0.0.4 GET /api/users 500
The LLM might return:
Main findings:

1. Two requests to /admin returned HTTP 404.
   This may indicate a missing endpoint or users requesting
   a URL that does not exist.

2. /api/users returned HTTP 500.
   This indicates a server-side problem and should be
   investigated.

3. IP 10.0.0.3 repeatedly requested /admin.
   Review whether this traffic is expected.
Now our raw machine-generated logs have become a much easier-to-read troubleshooting report.
Understanding HTTP status codes
Since we are analyzing Apache logs, it helps to understand the broad HTTP status-code categories.
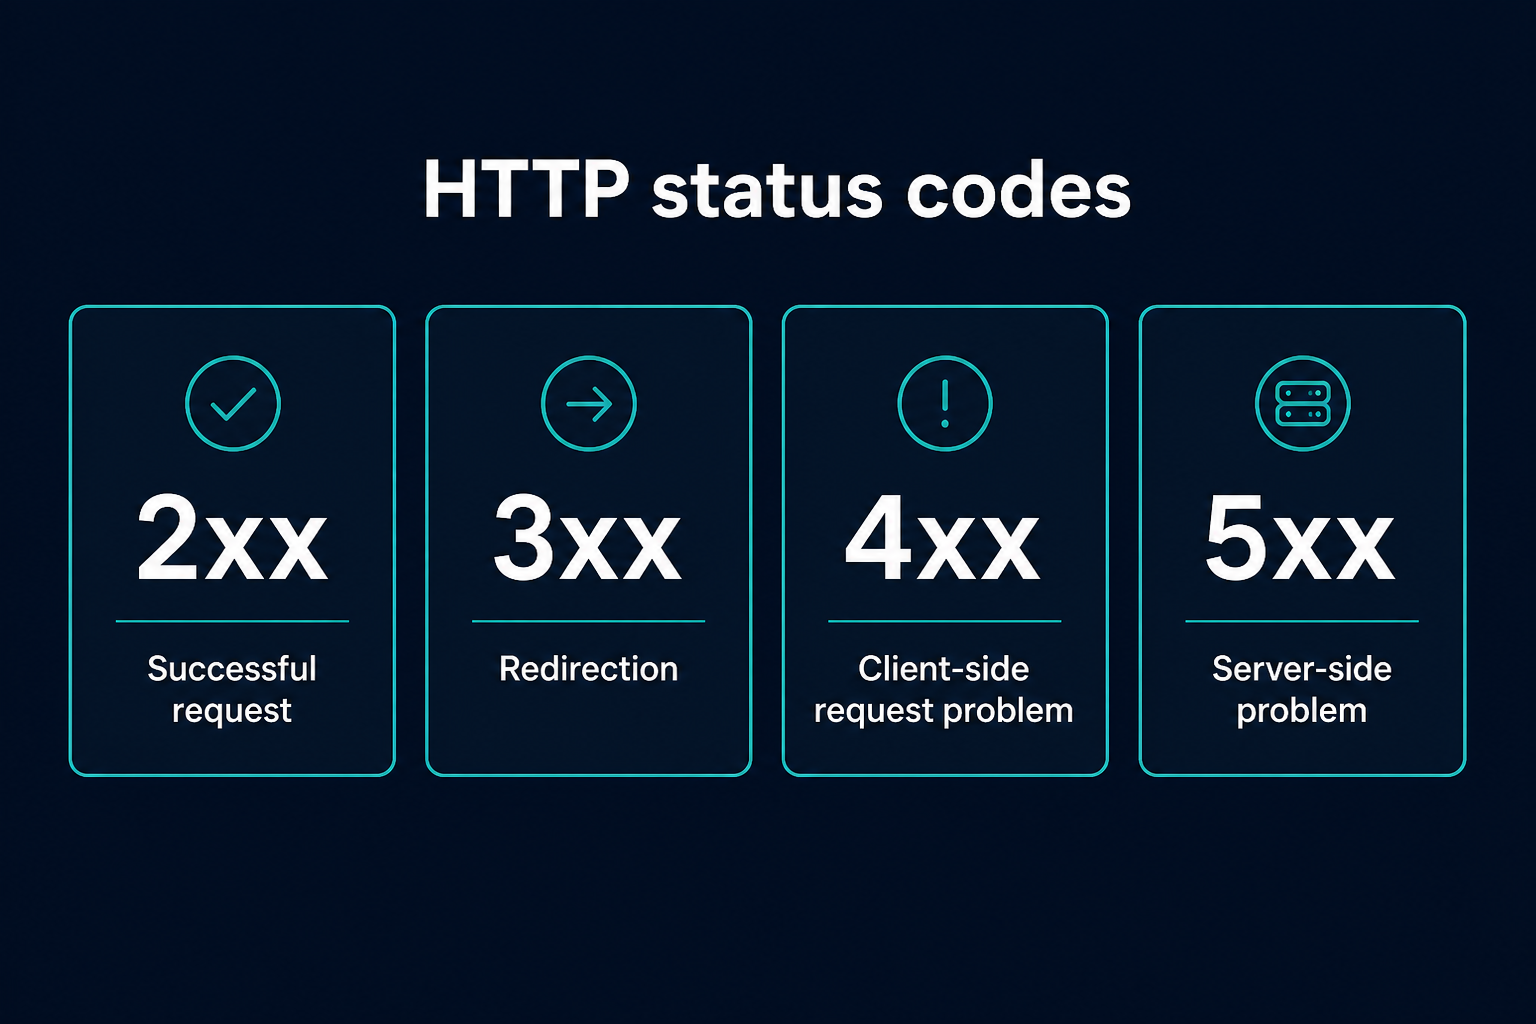
Some common examples are:
200 → OK

301 → Redirect

400 → Bad Request

401 → Unauthorized

403 → Forbidden

404 → Not Found

500 → Internal Server Error

502 → Bad Gateway

503 → Service Unavailable
AI should improve our troubleshooting.
It should not replace our basic technical knowledge.
Detecting repeated 404 errors
Suppose our logs contain:
192.168.1.20 GET /wp-admin 404

192.168.1.20 GET /wp-login.php 404

192.168.1.20 GET /wordpress 404

192.168.1.20 GET /phpmyadmin 404
One request returning 404 may not be interesting.
But repeated requests from the same IP to common administrative URLs could deserve attention.
The model might explain:
The IP 192.168.1.20 is repeatedly requesting administrative
paths that do not exist on this server.

This could be an automated scanner searching for commonly
exposed applications.

Consider reviewing this IP's request frequency and checking
your security controls.
Notice something important.
The model isn't just translating:
404 = Not Found
It is identifying a pattern across multiple log entries.
That is where LLM-based analysis can become useful.
Detecting 500 errors
Suppose we have:
10.0.0.5 GET /api/orders 500

10.0.0.6 GET /api/orders 500

10.0.0.7 GET /api/orders 500
The pattern suggests that the problem may not be with a particular client.
The endpoint itself may be failing.
The AI could recommend checking:
Application logs
Backend service health
Database connectivity
Recent deployments
Configuration changes
Resource usage
This does not mean the model knows the exact root cause.
It means it can help us decide:
What should we investigate next?
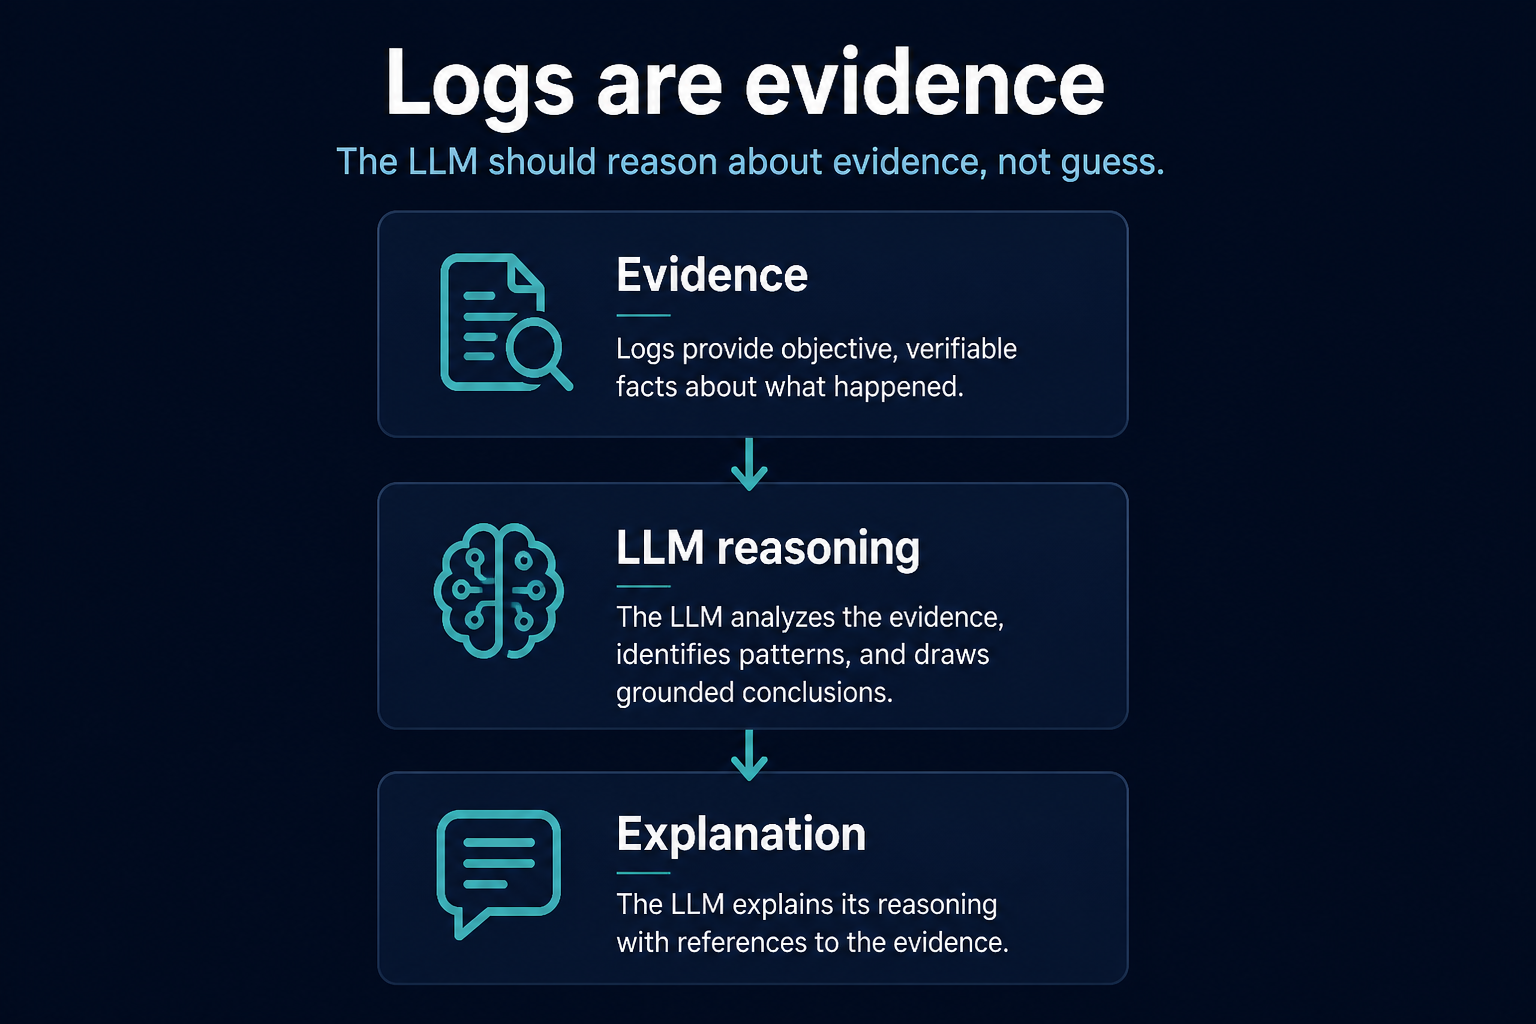
Logs are evidence
This is one of the most important concepts in the lesson.
The LLM should not guess what is happening on our server.
We give it evidence.
In this example, that evidence is:
Apache Logs
Then we ask the model to reason about that evidence.
So the architecture is:
Linux troubleshooting
For Linux:
uptime
free
vmstat
iostat
        ↓
Evidence
        ↓
LLM
        ↓
Diagnosis
Kubernetes troubleshooting
For Kubernetes:
kubectl get pods
kubectl describe
kubectl logs
        ↓
Evidence
        ↓
LLM
        ↓
Root Cause Analysis
AWS troubleshooting
For AWS:
CloudWatch Logs
CloudWatch Metrics
CloudTrail
        ↓
Evidence
        ↓
LLM
        ↓
Troubleshooting suggestions
Apache troubleshooting
For today's project:
Apache Access Logs
Apache Error Logs
        ↓
Evidence
        ↓
LangChain
        ↓
OpenAI
        ↓
Analysis
The source of the evidence changes.
The pattern remains very similar.
Why not ask ChatGPT directly?
You might wonder:
Why build an application? Why not copy the logs into ChatGPT?
For five lines, you absolutely could.
But imagine building something automatic.
For example:
Apache Server
      ↓
New logs
      ↓
Python application
      ↓
LangChain
      ↓
OpenAI
      ↓
Analysis
      ↓
Slack
Now your system could potentially generate a troubleshooting summary automatically.
Or:
Error spike detected
      ↓
Collect relevant logs
      ↓
AI analyzes logs
      ↓
Create incident summary
      ↓
Send to DevOps engineer
That's where connecting an LLM programmatically becomes much more powerful.
But AI should not replace your observability tools
An LLM is not a replacement for tools such as:
Prometheus
Grafana
Elasticsearch
Splunk
Datadog
CloudWatch
Loki
Those systems are designed to:
Collect massive amounts of data
Store logs
Search efficiently
Aggregate metrics
Create dashboards
Generate alerts
An LLM is better thought of as another layer.
For example:
Observability Platform
        ↓
Find relevant evidence
        ↓
LLM
        ↓
Explain what it means
The observability platform finds the data.
The LLM helps interpret it.
Be careful with sensitive information
Logs can contain sensitive data.
For example:
IP addresses
Usernames
Email addresses
Request parameters
Tokens
Internal URLs
Session identifiers
Application data
Before sending production logs to an external LLM, you need to understand:
What data is being sent?
Where is it being processed?
What information should be removed?
What does your company's security policy allow?
For experiments and learning, use test or sanitized logs.
What did we actually build?
At first glance, it may look like:
We sent an Apache log file to OpenAI.
But there is a more important architecture underneath it.
We built:
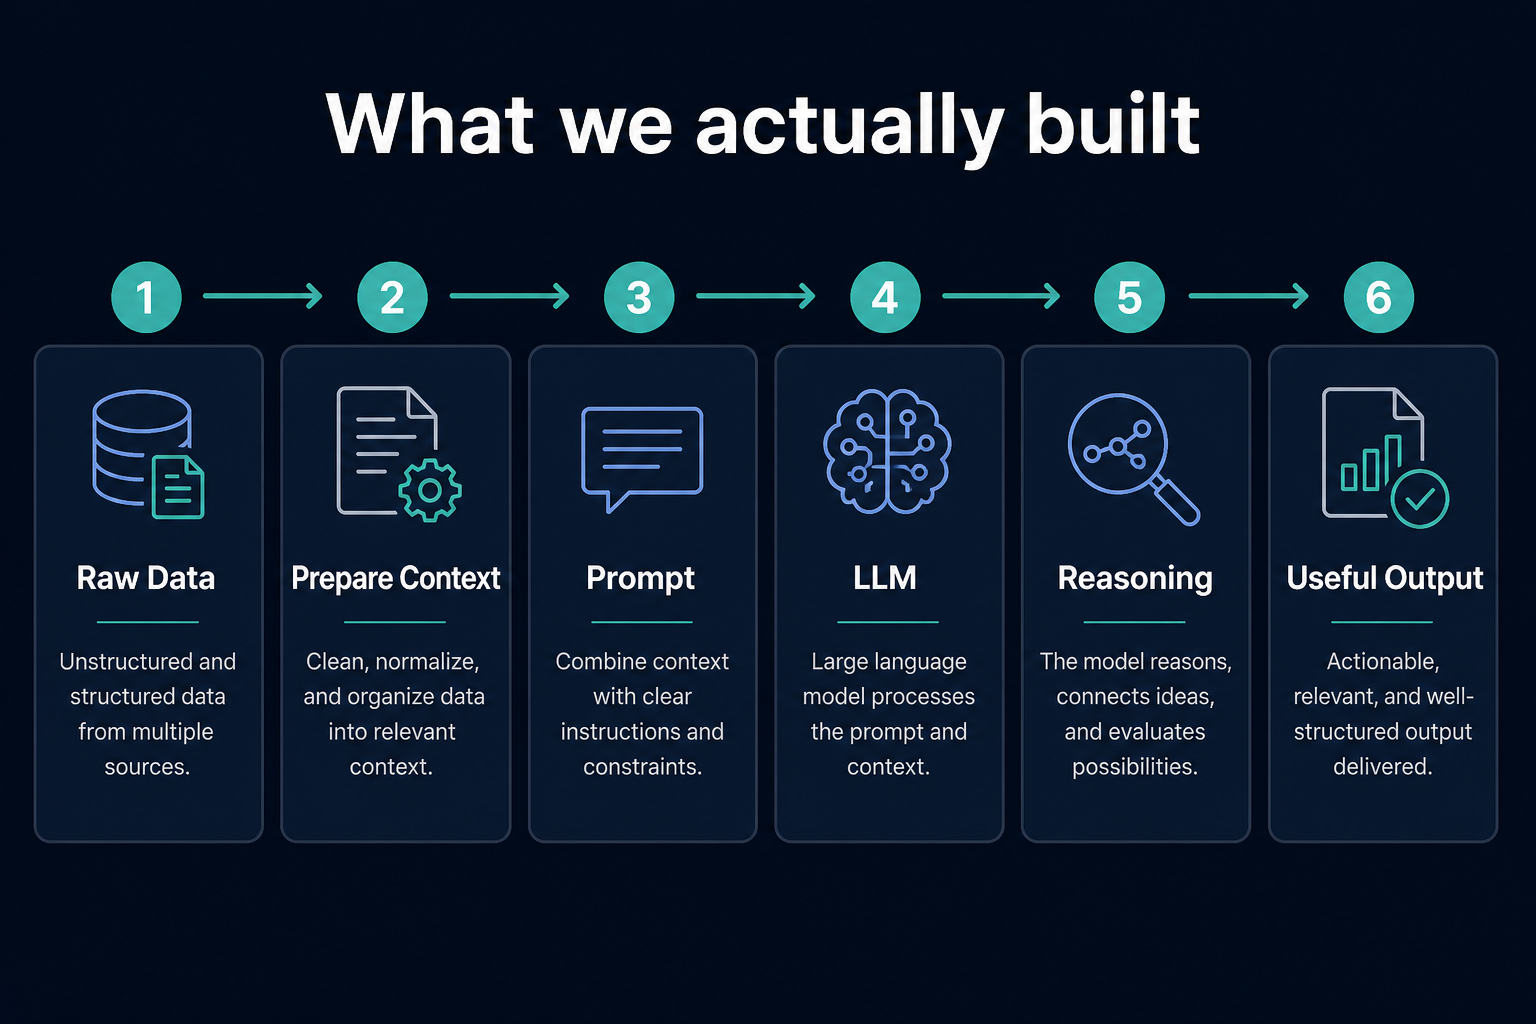
For our example:
Apache Logs
   ↓
Python
   ↓
LangChain
   ↓
Prompt + Logs
   ↓
OpenAI
   ↓
Log Analysis
What could we add next?
Once you understand the basic version, you can extend it.
For example, instead of analyzing a static log file:
Apache Log File
      ↓
Analyze
we could build:
Live Apache Logs
      ↓
Detect errors
      ↓
Extract relevant lines
      ↓
LLM analysis
      ↓
Slack notification
Or:
500 errors increase
      ↓
Collect surrounding logs
      ↓
Analyze with LLM
      ↓
Generate incident summary
Or eventually:
Alert
   ↓
Collect logs
   ↓
Collect metrics
   ↓
Collect deployment information
   ↓
LLM analyzes all evidence
   ↓
Root Cause Analysis
Now we are moving toward a real AI-powered troubleshooting system.
AI analysis vs traditional scripts
There is also an important distinction.
If you simply need to count 500 errors:
grep " 500 " access.log | wc -l
is probably better than calling an LLM.
You don't need AI for everything.
Traditional code is excellent when the rule is clear:
Count something
Filter something
Match a pattern
Calculate something
LLMs become useful when we want more flexible interpretation:
Explain the main problems.
Summarize unusual patterns.
What might these errors indicate?
What should an engineer investigate next?
A good system often combines both.
For example:
Python / grep
      ↓
Filter relevant errors
      ↓
LLM
      ↓
Explain them
That is often better than sending every log line directly to the model.
A better production architecture
Eventually, instead of:
Entire Log File
      ↓
LLM
we might build:
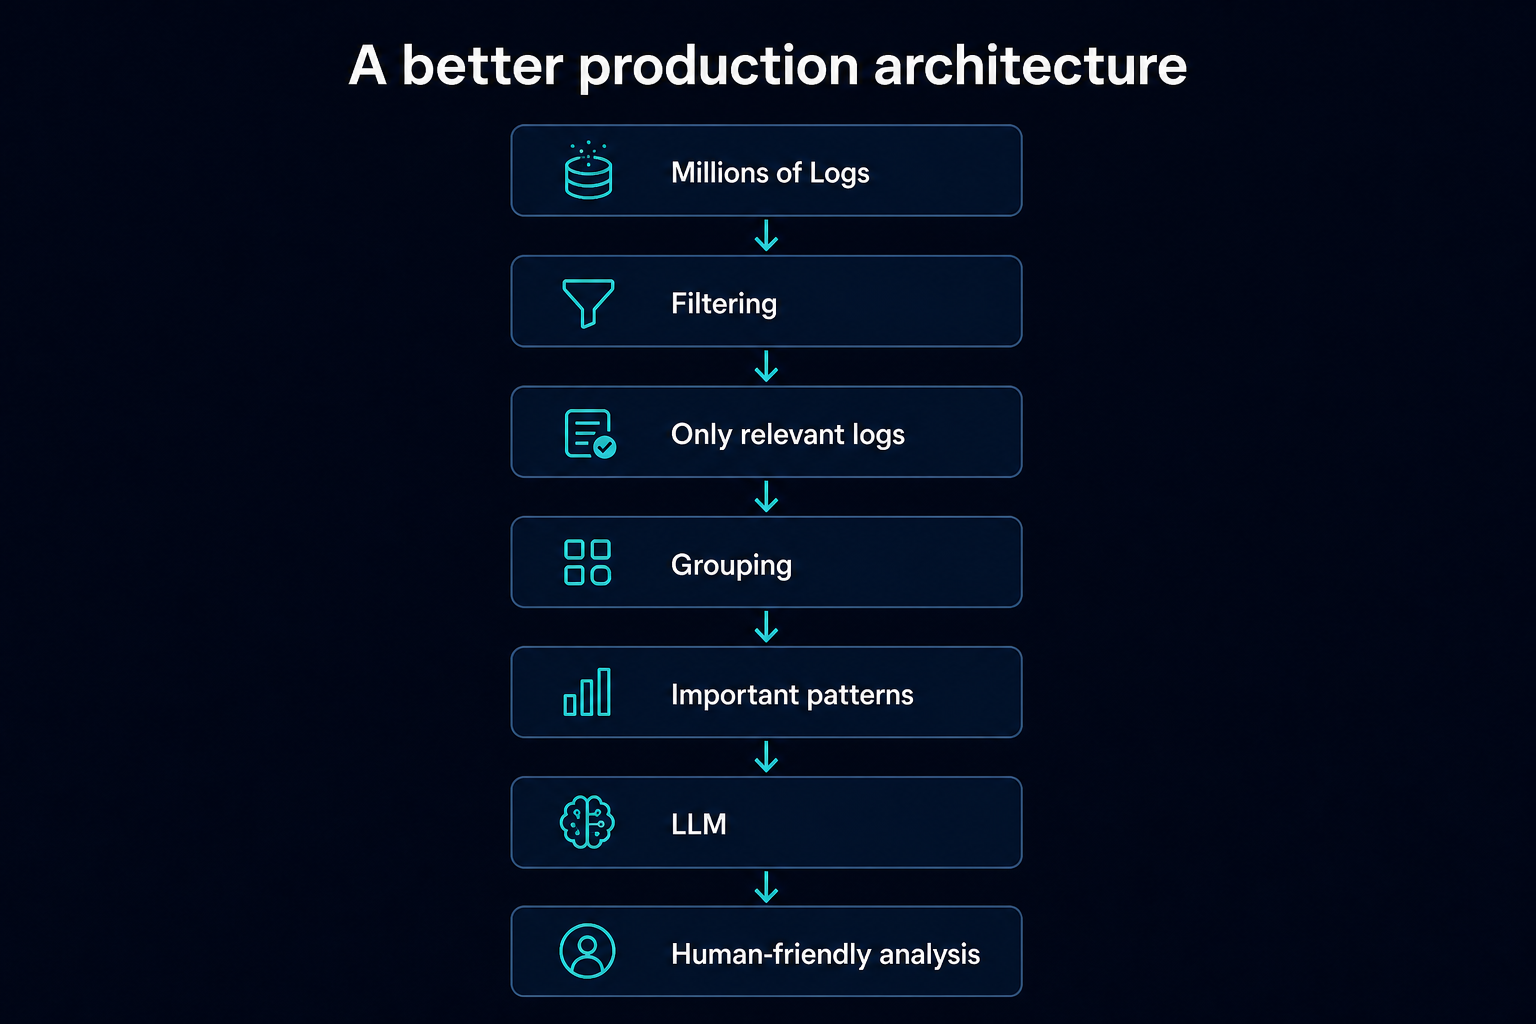
Five things to remember
1. Logs are evidence.
They tell us what happened inside or around an application.
2. LLMs can help interpret logs, but they do not replace traditional log tools.
Use the right tool for the right problem.
3. LangChain helps connect application data with an LLM.
In our case:
Apache Logs → LangChain → OpenAI
4. A clear prompt produces a more useful analysis.
Instead of:
Analyze this.
provide specific instructions:
Find errors.
Identify repeated patterns.
Highlight suspicious requests.
Explain possible causes.
Recommend next steps.
5. Give the LLM relevant evidence, not unlimited data.
In production, filter and reduce logs before sending them to a model.
If you remember only one diagram from this lesson, remember this
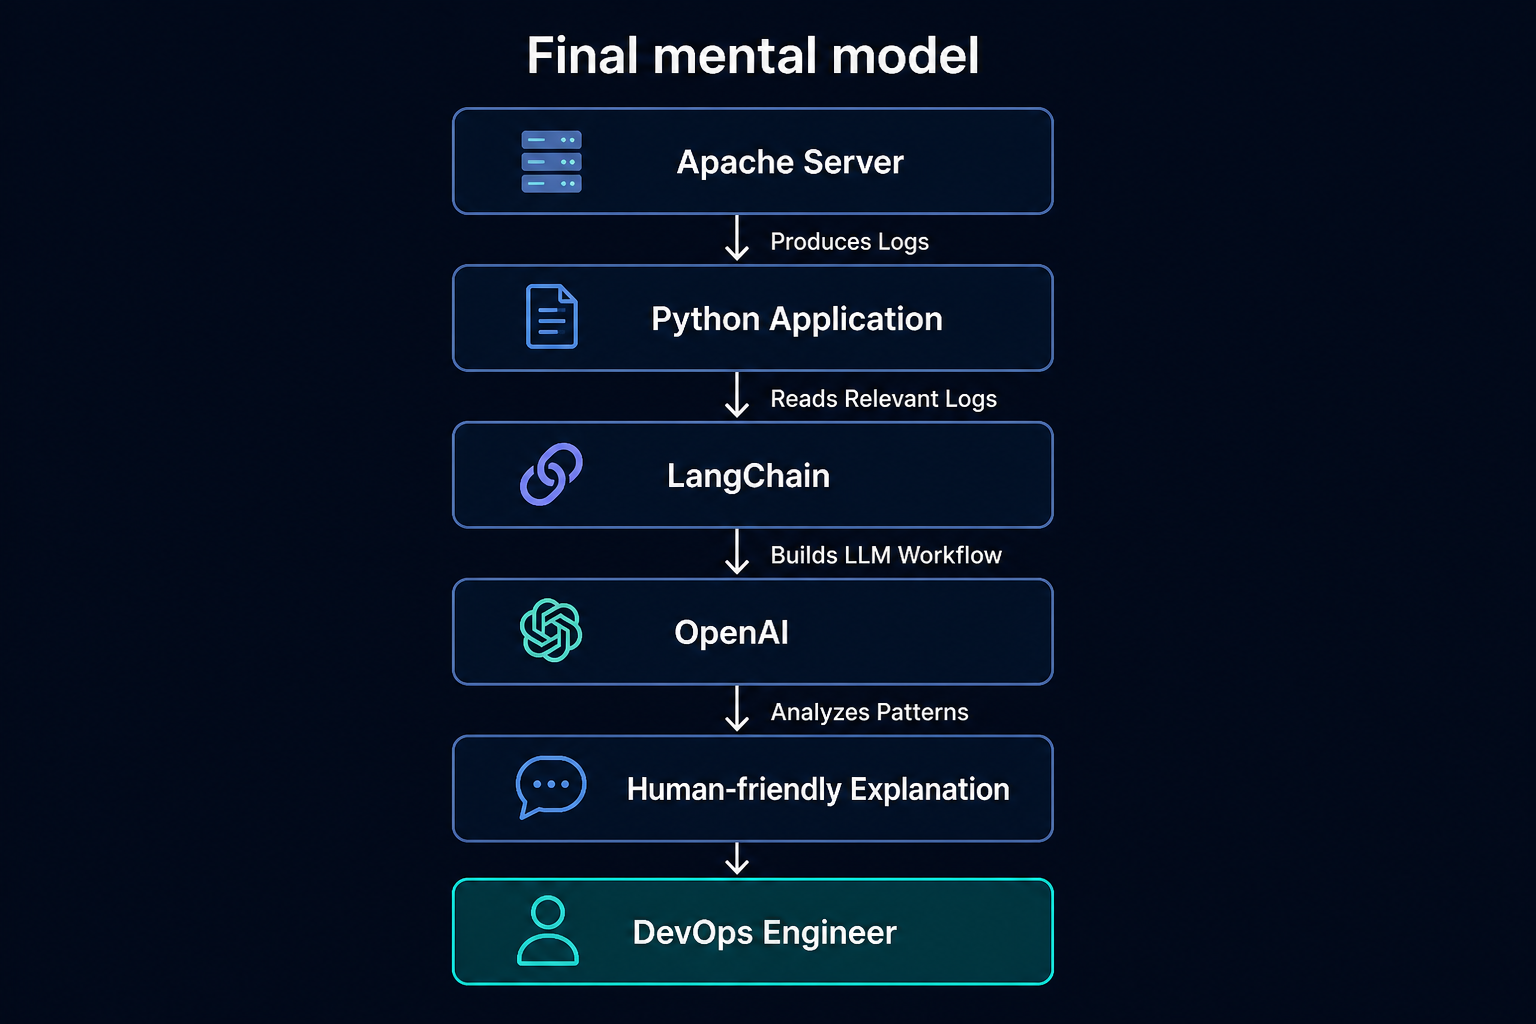
The most important idea is:
Logs provide the evidence. LangChain helps connect that evidence to the LLM. OpenAI helps us understand and explain what the evidence may mean.
The AI is not replacing grep, Splunk, Grafana, or the DevOps engineer.
It is helping the engineer move more quickly from:
Thousands of raw log lines
to:
"Here are the important things you should investigate."
And that is the real value of an AI-powered log analyzer.
GitHub repo: llm_log_analysis